|
7.10
"Think Like a Fish" to identify limiting factors
There are numerous survey forms and approaches to assessing
fish habitats. Generally you can find a form for any given jurisdiction,
and in some cases extensive manuals on how to fill them out
and computer programs to help analyze the data. Many have been
developed to provide information to fisheries stock managers
or to provide information for single species fish habitat models.
The biggest challenge with any of the forms is how to interpret
the data once it is collected. How do you find the aspects of
the watercourse, known as variables, that are limiting the productivity
of the habitat? Is it necessary to do detailed assessments if
one or two of the variables, are obviously weak? What protocol
do you follow to ensure the data is comparable between assessors,
years, other rivers and the habitat models?
Following through the chart below is a strategic planning process,
(not a linear process) where you have to complete the steps
in the order presented. You should access the current situation,
set your goals and priorities, take action, and monitor successes
and then repeat the process until you have restored the productivity
of the habitat. You may find that land use in the watershed
is so bad that it has to be mitigated before any other action
is taken. This is often the case and that is why it is the first
thing we look at. However there is little sense in working hard
on land use issues if the pH of the water due to acid rain is
so low as prevent sustainable fish production. Or you may find
that land use is a chronic problem that needs to be addressed
in the lower reaches of the watershed but the habitat is fragmented
by hanging culverts, or long reaches without pools, and your
first priority would be to get the migrating fish up to the
good habitat. Each watershed has different needs and priorities;
there isn't a step-by-step cookbook approach that fits all situations.
If you live in one of the few un-impacted areas in the Maritimes,
it is very important that you organize to protect the ecosystem
by maintaining natural ecological processes and preventing impacts
from human activities. Monitoring the health of the ecosystem
is a good idea to ensure things continue to function well.
To design a monitoring program, you first consider the aspects
of the ecosystem that are the most at risk from activities in
the watershed or along the coast. Focus on monitoring the changes
that would be caused by these activities. For each variable
monitored you should determine the range of natural variation
and set target limits that the variable should stay within.
For example, if you are monitoring water temperature on the
river it will fluctuate each hour and over the summer as the
air temperature changes. This is natural variability. If a healthy
summer temperature is under 20C and your data shows it is getting
warmer each year or exceeding 200C, then you need to take action
to solve the problem. The 200C would be a trigger value that
would initiate an action plan. The action plan should be developed
at the start of the monitoring program and include all the partners
and government agencies who will need to be involved in the
solution and their roles.
If you are not sure what monitoring to do or there are no imminent
threats, then a general health-monitoring program should be
undertaken. If these variables are within normal ranges, there
is little need to worry. However if a variable starts to change
or reaches levels for concern you would take action to investigate
the cause with further tests.
For freshwater systems, you should monitor for temperature,
pH, conductivity, and dissolved oxygen, plus nutrients, metals,
hydrocarbons if you suspect these are problems, and a secchi
disc or visual assessment for turbidity, plus an annual walk
to assess changes in bank erosion and adjacent land use. More
detailed monitoring can include programs to monitor invertebrate
populations and fish populations and there are protocols available
to undertake this level of monitoring.
For estuary ssystems, monitor salinity, temperature and a secchi
disc or visual assessment for turbidity, plus an annual walk
to assess changes in bank erosion and adjacent land use. If
eutrophication is suspected, a chlorophyll a test and a macrophytes
survey may help confirm it.
Once it is determined that you have degraded habitats, you need
to address the cause of the problems first. You cannot make
progress in restoring habitats if the activities that destroyed
them are continuing. In cases where the problem is bigger than
the local watershed, for example acid rain, then it is reasonable
to undertake mitigation efforts before the overall problem is
solved and cleans itself up. In ether case you should work through
the process below to help set out the order in which issues
are tackled and to help ensure all the problems are covered.
|
| |
Land use erosion and runoff problems
For most non-point or the larger more identifiable sources,
there are regulatory processes in place to try to control their
impact. These sites are easily identified as muddy runoff from
farms and forestry operations, discolored water from pipe outfalls,
and large percentage of the watershed area covered by hard impermeable
surfaces draining into storm sewers. Not all erosion and runoff
cases are covered by permits or regulatory controls during the
normal operations. No one applies for cows in the brook or sheet
erosion from farm fields or erosion from skidder tails, etc.
These have to be dealt with by contact with the landowner and
encouraging them to use best management practices.
Water quality
Water quality for fish and wildlife is a major problem in the
Maritimes. Large areas are suffering from the impacts of acid
rain that has lowered the pH and resulted in a lower productivity
of the habitats. Connected with this are increased levels of
dissolved metals leached from the soil by the acid. The second
most common problem is sand and silt from small but common poor
land use activities and bank erosion. The pile of earth on a
front lawn, the newly seeded lawn, the new gardens, or the dirt
washed off vehicles and equipment get into storm sewers of ditches
and into the streams. Thirdly, there are nutrients and chemicals
from common activities, fertilizing the lawn, washing the car,
pesticides and cleaners, and poorly constructed or poorly maintained
septic systems. The rain is capable of washing these chemicals
and nutrients into ditches, storm sewers, and watercourses.
The numerous small sources add up to big problems.
Fragmentation of habitats
A common problem in rivers and coastal areas is the fragmentation
of habitats and the partial and total blockage of migration
routes. These include culverts, dams, fishing gear set illegally,
causeways, debris, and long reaches without adequate depth or
resting pools.
Riparian
quality and processes
Adjacent to all water bodies is a strip of vegetation that creates
productive and unique wildlife habitats and contributes to the
stability, form, and productivity of the aquatic habitats. The
width of the area varies depending on the lay of the land and
the flood patterns. Experienced foresters and biologists can
see the change in the vegetation and define the edge of the
riparian zone. For regulatory and guideline purposes distances
have been set to define the riparian zone for stream protection.
This is not usually adequate for wildlife and care must be used
when working with these distances if they are intended to be
buffers to prevent damage to streams. Riparian zones have considerable
capacity to buffer impacts including removal of sands and silts,
remove excessive nutrient loads and many chemicals, and regulate
groundwater input to streams. However look closely at these
buffer areas to be sure the pollutants are just not channeling
through the area or overwhelming the mitigating capacity. Riparian
zones (greenbelts) should be left between water and all land
use activities.
Physical
habitat quality and processes
Changing flood and flow patterns, past use of the river, ice
scour, new man made control points which restart meander patterns,
and the lack of slow but regular input of large organic debris
all contribute to degraded physical habitats. The fact sheets
at the end of this manual focus on instream techniques to restore
the natural functions of the stream ecosystem.
If you do not have a degraded habitat or have been successful
in your restoration efforts, the most important thing is to
enjoy the healthy environment you are living in.
Looking for the limiting Habitat variables.
Habitat assessment is a process of determining the limiting
factors and is a critical pre-requisite to determining the productive
capacity of the habitat and the restoration requirements. Such
information is not available for watercourses in the Maritimes
despite intensive surveys on some rivers. If it were available
it would make the design of a restoration project much easier.
Unfortunately, it is not easy to identify all of the limiting
factors and each watercourse can have its own unique combination
of factors that interact to limit the productivity throughout
the year.
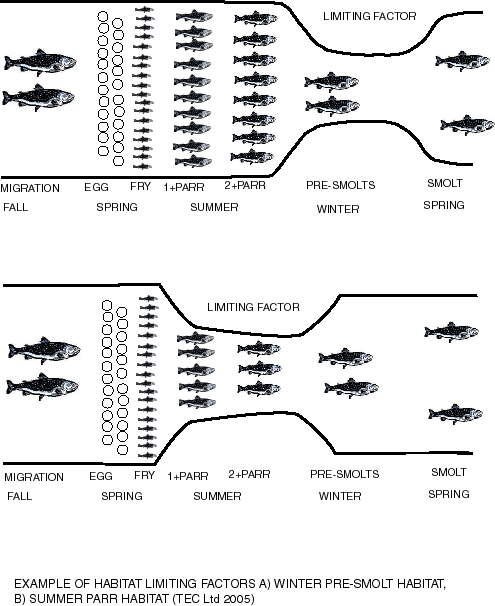
Limiting factors should be thought of as bottlenecks through
which all the fish and wildlife have to pass. If the bottleneck
habitat will only allow a few individuals to survive, then that
habitat controls or limits the productivity. The diagram below
is a depiction of how a limiting habitat can effect the population
of Atlantic salmon.
|
| |
Generally you can divide Nova Scotia into four major groups
of watersheds: the Inner Bay of Fundy, southwest Nova and the
Eastern shore, the Gulf shore, and Cape Breton.
The Inner Bay of Fundy rivers have good pH, and gravel cobble
substrates ideal for salmonids but the salmon populations have
collapsed due to what appears to be at-sea mortality. The objective
in this area is to undertake stream habitat restoration to optimize
the productivity for the fish that do return from the sea and
their offspring, and the resident species. Inner Bay rivers
have the lowest summer rainfall of anywhere in the Province,
and recent weather patterns have brought the warmest driest
summers on record over the past 15 years; throughout the year
rainfall events have been shorter and more intense, increasing
the size of the 1-in-2 year flood flow. The more intense storms
cause more runoff and less percolation of water into the ground
to recharge the water table. The result has been a widening
of the watercourses and a lengthening of the meander patterns,
resulting in poor quality pools for juveniles in low flow and
for migrating adults to use for holding and resting. The lowered
water tables are resulting in dry tributaries and extremely
low summer and winter flows. This has been aggravated in some
watersheds due to poor land-use practices and the need to harvest
budworm-killed forests in Cumberland County. These rivers respond
well to restoration, but in some cases the lowered water table
has reached the point where even restored pools go dry.
Southwest Nova and the Eastern shore have thin soils and granitic
bedrock that have not been able to buffer acid rain. The resulting
low pH in the rivers has lead to extinction or near extinction
of salmon in many rivers and has stressed the trout populations.
This area has also suffered from the change in rainfall patterns;
however, the heavy boulder cobble substrates are holding the
meander patterns in place. Good water quality is still available
in areas with drumlins or other glacial deposits with water
buffering capacity. The heavy boulder substrate in most of these
rivers makes it difficult to use the habitat restoration structures,
so the focus for restoration is on water quality and getting
the most out of the small tributaries with high pH and cool
water. Rivers with good gravel cobble and pH or sections with
these features need to be optimized to maintain stocks while
the pH is restored.
The Gulf shore rivers have good substrate and pH and so still
support healthy salmon and trout populations. Past and present
land use impacts are the main source of habitat decline. These
can be corrected with best management practices and the habitat
restoration techniques. The fish populations respond well to
restoration. These watersheds are also stressed by climate change,
but they do receive more storms in the summer than the rest
of the mainland which keeps the water level up, especially in
the lower reaches.
Cape Breton rivers have been affected by the change in climate
which was compounded in many watersheds by the budworm forest
harvesting; both of which have increased the size of the 1-in-2
year flood flow, widening the rivers and lengthening meander
patterns. As the forest reestablishes, these flows are decreasing
in size and the rivers are trying to reestablish narrower channels
with shorter meanders. The lower reaches of many rivers have
been seriously impacted. Summer rainfall on the Gulf side watershed
is still good but many areas in the shadow of the highlands
face serious summer droughts. The good pH in this area gives
us the opportunity to restore habitats where the runoff patterns
are stabilizing.
These are generalizations of rivers in large areas with highly
variable geology and land use patterns. In every area there
are exceptions. You have to get to know your river and fish
habitats. The limiting factors may be as described above but
there are refuges the fish can use in times of stress and improving
these refuges can show significant results.
The best approach for a community group is to "think like a
fish". To do this you select common species in your watershed
and starting with the spawning migration, think through the
needs of the species in each life stage and season. What do
they need to be healthy and grow in your estuary and river?
To answer this question the tables which follow list the variables,
which individually or in combination, commonly limit the fish
habitat productivity of watercourses in the Maritimes. In the
adjacent columns are the ranges for the variables that are considered
to be excellent, good and not sustainable for a selection of
common sport fish and indicator fish species. These values are
intended for use in identifying limiting habitat variables;
they are not to be considered the levels at which everything
falls apart and the population collapses. Use them as guides
to determine where to focus the restoration work. For values
used in habitat violations or environmental impact assessment
you should contact your local DFO biologist.
Next is a brief description of the sampling protocols for each
variable so that your data will be consistent throughout your
assessment from year to year for monitoring and be comparable
to other assessments in the region. For those who are interested
in different sampling methods and standard techniques, contact
the Adopt-a- Stream coordinator.
Our objective in the restoration of the habitats is to work
with nature to move the limiting variables into the good or
excellent range. So, when you have the assessment done, the
Adopt-a-Stream coordinator will help you select the appropriate
techniques to restore the habitat. You will find that many of
the techniques used to restore the physical habitat solve problems
with many of the limiting variables.
The actual layout of instream structures is not explained in
detail and requires someone trained in the hydrology of watercourses,
and the design and layout restoration techniques to complete
the plan for the project. Layout is very important because if
the structures are not sited properly, they may not create the
improved habitat, they may becoming buried, washed out, or in
rare cases create their own limiting factor. A poor design is
the most common reason for the failure of restoration projects.
To avoid wasting all your efforts, get a trained person to spend
a couple of days doing a proper layout.
The spacing between instream structures is normally six channel
widths, and the scale of instream structures and of the other
techniques can be determined from surveying the sites and using
the information provided in the restoration fact sheets in Chapter
9. With this information, you can develop a good estimate of
the extent of the work required and estimate costs and the logistics
of getting the work done. In some cases there will be additional
techniques better suited to the site, which will need to be
used. However they are not currently approved under guidelines
so will be used only as needed with approval of NSEL and DFO.
Assessment methodology:
Select the species that frequent your stream or you are trying
to restore the habitat for and should be present. Then think
about each life history stage and consider all of the variables
that are listed below for each of the species you have selected.
Based on existing data or local and traditional knowledge, select
those variables that have the potential to be limiting in your
watershed and provide an explanation of why you think the other
variables are not limiting. For example, if you know the pH
in your river and in all the tributaries stays in the Excellent
or Good range for salmonids all year long, then it can be eliminated
from the survey. If, however, the summer temperature rises into
the mid-20's in the lower reaches or any of the tributaries,
then it is important to measure temperature throughout the watershed
during the warmest part of the year to find the viable habitats
and identify reaches that can be rehabilitated. Basically you
build the data collection needs to assess and monitor the limiting
variables for the community of species which are or should be
inhabiting the watercourse if it were healthy.
It is almost impossible to do a complete assessment in one pass
along the stream. Some experienced assessors can see the problems,
which will exist at other times of the year, but even this expert
opinion is often wrong because each watershed has its own characteristics.
So be prepared to get to know your stream in all four seasons
particularly the critical low flow periods in summer and winter
and the spring fry emergence and fall spawning periods.
The information provided below is for three common salmonids
because they are usually used as indicator species for watercourse
restoration projects. Information is available for a wide range
of species.
Sampling Protocol
For all samples and data it is important that you accurately
record the site:
-The location either with GPS, topo map grid references, permanent
markers such as sites numbers painted on trees or boulders,
or accurately described i.e. Nine Mile Brook at the outlet of
the culvert on Highway 14. Mark the location on as detailed
a map or aerial photo as you have available. 1:50,000 maps are
good but 1:10,000 are better.
- The time and date the sample or measurement was taken.
- The equipment used to take the measurement or sample.
- The name of the person taking the sample or measurement and
the recorder.
- The weather during sampling.
- Photograph the area, noting the photo number, and the direction
you are facing.
- All right - left directions in the fact sheets and plans are
given as if you were facing downstream.
Measurements are normally taken on a reach-by-reach basis. The
length of a reach can be set at a standard length (i.e. each
50m) or each habitat unit, which is six times the channel width.
This last method will give you a new reach length at the junction
of each tributary. For initial surveys of a watershed, assessments
may be taken just at the junction of tributaries. Reaches would
be assessed on the main stem above and below the tributary and
one in the tributary. This will give you an overview of the
health of the habitats and help identify where to focus your
efforts. |
| Salmonids
(Atlantic salmon, Brook trout, Brown trout) |
| Migration
|
Estuary
Salmonids coming in from the estuary hold in depressions in
the bottom in salt/brackish water at the head of tide. They
hold in these areas for various lengths of time and if conditions
for river migration are not good they return to the near coastal
areas to feed, checking on the river conditions some weeks later.
When the river flows are right for migration, they move up into
the fresh water. If this holding area is impacted by development
or is changing due to sedimentation the number of fish that
can hold in the area can be reduced. This will limit the number
of fish that will migrate on a freshet and the numbers that
move into the river over the spawning migration.
|
| |
Notes
- Adults require these depths and velocities only during migration
to spawning areas. Values less than this will commonly be found
in summer and fall low flow periods and will halt migration
at these times.
- Adults will swim against the preferred velocity or as close
to it as they can find, mid-water in shallow flows, and secchi
disc depth in deeper waters. Secchi disc depth is the depth
to which you can see a white object lowered into the water.
- Using burst speed the fish can get past short sections with
higher velocities. They can swim at velocities up to 10-body
lengths/sec for up to 10 seconds. If this velocity is enough
to cover the required distance, swimming against the flow, then
it is passable but should be considered a partial barrier if
the flow is greater than the Max. velocity listed.
- To fully utilize the fish habitat, spawners should be able
to go as far up the stream as possible to get the optimum distribution
of fry. Even the larger salmon and trout will use small first
and second order streams if access and holding pools are good.
Sampling protocol
Walk up the river during migration season and follow the route
the fish would take based on depths, velocities, (table above)
and pool quality and frequency (tables below). Note the areas
of river the fish would have trouble passing through. These
may be wide shallow sections without pools, or culverts, dams
or debris jams.
Equipment
Meter sticks, floats, stopwatch and camera
|
Notes
This classification of pools should be done in conjunction
with the percent pool, and pool frequency assessment.
Salmonids need to hold in the stream near the spawning
areas and they all look for good water depth, low velocities,
and cover.
The holding capacity of the pools can regulate the number
of spawning fish in well-stocked streams. |
|
Notes
This classification of pools should be done in conjunction
with the percent pool, and pool frequency assessment.
Salmonids need to hold in the stream near the spawning
areas and they all look for good water depth, low velocities,
and cover.
The holding capacity of the pools can regulate the number
of spawning fish in well-stocked streams.
Sampling protocol
Rate all pools according to the following classification
scheme.
First-class pool: Large and deep. Pool depth and size
are sufficient to provide a low velocity resting area.
More than 30% of the pool bottom is obscured due to depth,
surface turbulence, or the presence of structures such
as logs, debris piles, boulders, or overhanging banks
and vegetation. Or, the greatest pool depth is >1.5 m
in streams <5 m wide or >2 m deep in streams >5 m wide.
Second-class pool: Moderate size and depth >45cm at low
flow. Pool depth and size are sufficient to provide a
low velocity (>0.5m/sec) resting area. From 5% to 30%
of the bottom is obscured due to surface turbulence, depth,
or the presence of structures. Typical second-class pools
are large eddies behind boulders and low velocity; moderately
deep areas beneath overhanging banks and vegetation.
Third-class pool: Small or shallow or both < 45cm at low
flow. Pool depth and size are sufficient to provide a
low velocity resting area. Cover, if present, is in the
form of shade, surface turbulence, or very limited structures.
Typical third-class pools are wide, shallow, reduced velocity
areas of streams or small eddies behind boulders. Virtually
the entire bottom area of the pool is discernible.
Fourth class pool: shallow sections of stream with low
gradient and size and depth are sufficient to provide
resting areas for parr. Cover is limited to spaces under
the substrate. The entire bottom is discernible.
|
Frequency of holding
and resting pools for migration |
| Pools are very important for fish
spawning migrations. The fish can swim against the currents
for distances that are related to their species, length,
and condition. Then they require low velocity water to
hold or rest in before moving though the next section
of river. The pools have to provide cover, low velocities,
and enough space for all the fish that need to rest there.
For migrating fish we are looking for the frequency of
first and second-class pools. |
|
Sampling
protocol
Channel widths are measured in stable sections of stream
straight across, between the base of the perennial terrestrial
vegetation on each side. Watercourses in the Maritimes
tend to be over widened by 20% due to ice activities and
past uses. This is particularly true in sections where
the pools are poorly developed. If this is the case at
the sampling site, reduce the width measurement by 20%
and use this number in assessing pool frequency.
Equipment Measuring
tape
|
Spawning areas |
Salmon and Brown trout spawn where
the water is drawing down through the gravel. These areas
are typically at the tail of a pool where there is a head
difference between the water level in the pool and the
downstream riffle or run. The head difference causes the
water to seep through from the tail of the pool, under
the crest of the riffle, and emerge on the riffle. A seepage
of 100cmhr is excellent to bring oxygen to the eggs and
remove wastes, but this flow is hard to find and measure.
Other areas with similar hydrology, such as the areas
above digger logs and small debris jams, and the edges
of pools where the seepage goes under the flood plain
before returning to the stream are also good sites. For
the fish to use the site the flow under the gravel has
to parallel the surface flow. Short steep riffles which
cross the river at more than 30 degrees have seepage and
surface flows which are not parallel and the fish are
seldom able to build successful redds. The sites are hard
for assessors to find but where the head differences exist,
the riffles are aligned closely with the flow, the bottom
gravels are not silted in, the area can be counted as
a spawning area.
Brook trout will use the same sites as the salmon, but
prefer areas where the water is upwelling. These areas
can be found along the edge of lakes and streams where
the ground water is at least 30cm higher than the watercourse
water level or where water is returning to the stream
after seeping under the flood plain. These areas can be
detected by the difference in water temperature in the
summer (colder) and winter (warmer) between the seep temperature
and the temperature of the stream. |
| |
Sampling
protocol
Must be sampled in the late fall October, November or
December, during moderate freshets. Measure the velocity
over the tail of the pool.
Equipment
Meter stick or survey rod for the depths, and a float
(an orange is good) and a stopwatch. |
|
Notes
- fine sand (0.06-0.50 mm);
- coarse sand (0.5-2.2 mm);
- gravel (2.2-22 mm);
- and cobble (22-256 mm) (Peterson 1978).
Sampling protocol
This is best done by measuring off an area 50 cm X 50
cm at the tail of a pool and visually estimating the percent
of each substrate size class. Other methods are available
see Hamilton (1984).
Equipment
Meter stick |
|
Sampling
protocol
This should be estimated for each reach.
Cover
Spawning adults need to have suitable cover to use during
the day to avoid predators. The closer the cover is to
the spawning area the better. This may be deep pools with
either colour, broken surface water, or organic debris
as cover; or undercut banks or digger logs, over hanging
vegetation, rate the availability of suitable sized cover.
|
Egg habitats |
| The eggs remain buried in the gravels
over winter, and need a flow or seepage of water to bring
them oxygen and remove wastes. It is also important that
the stream is stable and the redds are not washed out
or scoured by ice. |
|
Notes
Saturated is preferred for all water temperatures. |
|
Alevin |
| When the eggs hatch in the early
spring the alevins move between the spaces in the gravel.
It is at this point there are large losses of young fish
if there is sand and silt filling the spaces as the avins
cannot get out of the shell or straighten out and move
freely. When the alevins absorb the yolk sac and become
fry they swim up through the gravel to live in shallow
low velocity areas in the stream. Again the sand and silt
content of the gravel has to be very low to allow them
to swim up and to provide them cover from predators. The
process of digging the redd cleans the sand and silt out
of the redd area, but if the sand and silt content is
high in the substrate, it works back into the redd gravels
over the winter. |
|
Fry habitat |
| Emergent fry move out of the redd
up to 100m of stream mainly in the downstream direction
seeking suitable habitat. If the densities are too high
for the available habitat, the excess fry die in a few
days. It is important that low velocity shallow areas
with abundant cover in un-embedded gravel be readily available
for these young fish. |
|
Parr Habitats |
Parr
habitat summer and over winter
The primary limiting factors on parr are water temperature,
which is directly related to reduced oxygen and the lack
of suitable instream cover. |
|
Notes
- This is a very simple variable to monitor and a very
common limiting factor.
- Temperature has to be combined with oxygen to find suitable
habitats.
- For salmonids in streams or crowded conditions -- oxygen
> 6mg/L; in ponds or lakes where there is no current--
oxygen > 3mg/l. Levels below 6mg /l must not last more
than two weeks.
Sampling protocol
-Average maximum daily water temperatures have a greater
effect on trout growth and survival than minimum temperatures.
The temperature that supports the greatest growth and
survival is optimal. |
|
Notes
Assessments should be done at low flows, if this is not
possible you should measure the depth of the water at
the crest of the riffle below the pool and then estimate
how much pool there would be if the flow were lowered
by that amount.
Sampling protocol
Polls are areas in the watercourse that are deeper than
the average depth of the watercourse. This is measured
or estimated on a reach-by-reach basis.
Equipment
Measuring tape and meter stick or survey rod |
|
Notes
This classification of pools should be done in conjunction
with the percent pool assessment.
Sampling protocol
Rate all pools according to the following classification
scheme;
First-class pool: Large and deep.
Pool depth and size are sufficient to provide a low velocity
resting area. More than 30% of the pool bottom is obscured
due to depth, surface turbulence, or the presence of structures
such as logs, debris piles, boulders, or overhanging banks
and vegetation. Or, the greatest pool depth is >1.5 m
in streams <5 m wide or >2 m deep in streams >5 m wide.
Second-class pool: Moderate
size and depth >45cm at low flow. Pool depth and size
are sufficient to provide a low velocity (>0.5m/sec) resting
area. From 5% to 30% of the bottom is obscured due to
surface turbulence, depth, or the presence of structures.
Typical second-class pools are large eddies behind boulders
and low velocity, moderately deep areas beneath overhanging
banks and vegetation.
Third-class pool:
Small or shallow or both < 45cm at low flow. Pool depth
and size are sufficient to provide a low velocity resting
area. Cover, if present, is in the form of shade, surface
turbulence, or very limited structures. Typical third-class
pools are wide, shallow, reduced velocity areas of streams
or small eddies behind boulders. Virtually the entire
bottom area of the pool is discernible.
Fourth class pool: shallow sections of stream with low
gradient and size and depth are sufficient to provide
resting areas for parr. Cover is limited to spaces under
the substrate. The entire bottom is discernable.
Equipment
Meter stick or survey rod to measure depths |
|
Note
Trout can use streams with sand / silt bottoms if they
have sufficient cover for all life stages.
Sampling protocol
Measure 50 X 50 cm plots on the stream bottom and estimate
the percentage of each bottom type suitable for cover
in riffle, run, and pool areas.
Equipment
Measuring tape |
|
Sampling protocol
Visual estimate of the
percentage cover in a reach.
|
Pre-smolt habitats |
Atlantic salmon pre-smolts spend
the last winter in the river in pools feeding actively.
The best habitat is in first or second-class pools with
ice cover. This provides a diversity of cover, large enough
for the pre-smolts, and the ice cover helps regulate the
water temperature. These pools are often lacking in salmon
habitats and can limit the population by restricting survival
during this last stream stage.
|
Downstream migration |
Salmonids moving downstream face
into the current, moving out into the stream to find velocities
of 45 to 60 cm/sec to carry them down. In ponds and lakes
where the velocities fall below 15cm /sec they turn and
swim with the current or following the bank, seeking the
outlet. Swimming depth is mid-water where you can see
the bottom and secchi disc depth in deeper and coloured
water. Obstructions include debris jams and especially
dams because they have unnatural outlets. Dams often force
the fish to go deeper in the water to find bottom outlets
or rise to the near surface without the guidance of a
sloping bottom to find surface outlets. To assess these
obstructions you have to determine if the fish will find
the outlet at their preferred swimming depth and velocity.
|
General water
quality |
|
Note:
For lacustrine habitats, measure pH in the zone with the
best combination of dissolved oxygen and temperature.
Sampling protocol
During low flow periods the majority of the water in a
stream is ground water and this flow will have the highest
pH you can expect to find during the year. Low pH is found
during high flow period especially with the spring snowmelt.
Rain events from the west and southwest are also very
acid. Regular sampling assessments or continuous monitoring
is best but time consuming. For general assessments to
find limiting factors, sample during the period when the
pH is expected to be at its lowest value. |
|
Notes
Saturated is preferred for all water temperatures.
Sampling protocol
This is an important variable but very difficult to sample
during the winter. This sampling should be done if you
expect there is a high biological or chemical oxygen demand
created by land use activities in the watershed. This
is not a common limiting factor.
Clarity
|
|
General stream
structure and stability |
Sedimentation
and Suspended Soilds
A large volume of suspended sediment will reduce light
penetration reducing photosynthetic activity of phytoplankton,
algae, and rooted aquatic plants, especially those farther
from the surface. Overall, suspended sediment leads to
fewer photosynthetic plants available to serve as food
sources for insects and, in turn, a lower food supply
for fish.
Sediment introduced into surface water is either deposited
on the bed of the stream or lake or suspended in the water
column (suspended load). Bedload is large sediment particles
that move by bouncing and rolling along the bottom. Generally,
the suspended load in flowing water consists of grains
less than 0.5 mm in diameter. Lake suspended loads usually
consist of the smallest sediment fractions, such as silt
and clays.
The current transports particles in both the bedload and
the suspended load. Because the particles in the bedload
move by rolling or bouncing along the bottom, bedload
transportation occurs in flowing waters. These bed load
particles fall into the spaces between the gravel and
cobble in the stream bottom reducing insect habitat, filling
in juvenile fish escape and over winter cover, and plugging
spawning beds. The volume of sediment transported and
whether or not it is suspended or bedload is dependant
on the particle size and the flow velocity. A high flow
velocity can transport a greater number of larger particles
than can a slower current. Any sediment transported by
water is subject to deposition as flow velocity decreases.
The amount of sediment deposited on a rocky substrate
can be quantitatively defined by an estimation of the
percent embededness. The percent embededness is the degree
to which fine sediments such as sand, silt, and clay fill
the interstitial spaces between rocks in a substrate.
A 70% embedded substrate will cause changes to occur in
the structure of macro-invertebrate fauna and most fry
and small parr will leave an area or die when embededness
levels reach 50-60%.
Optimal Ranges |
| 0 to 10% embededness |
Excellent Conditions |
| < 25% embededness |
Good Conditions |
| 25 - 50% embededness |
Fair Conditions |
| 50 - 75% embededness |
Poor Conditions |
| > 75% embededness |
Non-Sustainable |
Note that trout can thrive in streams with high embededness
if the springs and seeps used for spawning are clean and
there is abundant instream cover in the form of undercut
banks and large organic debris.
A guide to percent embededness: Hamilton 1984
- 0% embededness = No fine sediments on substrate.
- 25% embededness = Rocks are half surrounded by sediment
but are covered by sediment.
- 50% embededness = Rocks are completely surrounded but
are not covered by sediment.
- 75% embededness = Rocks are completely surrounded and
half covered by sediment.
- 100% embededness = Rocks are completely surrounded and
completely covered by sediment.
Suspended solids should be kept to a minimum. USA and
European guidelines for salmonid streams set an upper
limit of 25mg/l as the long-term average and 80mg/l in
a grab sample. Canadian (CCME) guidelines for aquatic
life set a limit of 10 mg/l above background levels for
watercourses with background less than 100mg/l. As the
levels of suspended solids rise above 25 mg/l, salmonids
lose the ability to see the drifting food and insects
become detached from the substrate and drift. The growth
and condition of the fish is reduced the longer the suspended
solids are > 25mg/l during the growing season.
Bed loads in Maritime streams are primarily sands and
silts from erosion caused by poor land use and poorly
designed work around instream structures such as culverts
and bridges etc. As this bedload in fills the gravel/
cobble/boulder substrates, it prevents the river from
sorting these heavier substrates by "cementing " them
into the bed. The result is a river that has a shallower
cross section with poor thalweg and pool development,
and is approximately 20% over widened.
Restoration
Digger logs, rock sills, deflectors |
|
Sampling
protocol
Estimate the percentage of the reach shaded on a sunny
day. There are hand held convex mirrors with grids marked
on then for the estimation of forest crown cover that
are useful but not necessary. |
|
For all salmonids the dominant
substrate (>50% of the area)
A) Rubble or small boulders, or aquatic vegetation in
spring areas, dominate; limited amounts of gravel, large
boulders, or bedrock.
B) Rubble, gravel, boulders, and fines occur in approximately
equal amounts or rubble-large gravel mixtures are dominant
Aquatic vegetation may or may not be present.
C) Fines, bedrock, small gravel, or large boulders are
dominant. Rubble and small boulders are insignificant
< 25% . |
|
Sampling protocol
Combine the estimate of the two variables above
Measure 50cm X 50cm plots on the riffle areas and estimate
the substrate types.
Average percent
vegetation (trees, shrubs, and grasses) along
the stream bank during the summer for allochthonous (leaf
litter) input. Vegetation Index = 2 (% shrubs) + 1.5 (%
grasses) + 1(% trees) + 0 (% bare ground). |
|
Sampling
protocol
Visual estimates of the vegetation types and percent rooted
vegetation on both banks by taking sections of 10m (5m
to your right and 5m to your left) as you face the bank.
Sum up the totals for the reach. |
|
Sampling
protocol
These are difficult variable to monitor if the stream
does not have a gauging station or a staff gauge with
flow duration curves. However, you can see if there is
a problem by observing the flows and estimating which
category you stream fall into. Generally forested watersheds
with permeable soils fall into the excellent category
and more developed watersheds with hard impermeable surfaces
fall into the poorer categories.
Restoration techniques
Run off control and ensure ground water areas are recharged.
|
Lake Habitat |
The same water quality, cover,
and physical habitat variables apply to lakes. Lakes are
often holding areas for adult salmon during the summer
and may have small population of parr when the population
in the watershed is high or during times when the stream
habitats are unsuitable and the young fish fall back into
lakes. Shallow lakes warm to the bottom and usually have
water temperatures that are too high for good habitat
during the mid summer. Deeper lakes stratify with the
warm water on the surface and cool water suitable for
the fish 3 to 6 m down. The fish seek the preferred water
temperature. If the organic loading in the lake is low,
then the decaying material in the cool waters will not
reduce the oxygen level below 6mg/l and the salmon will
hold and trout will grow well. If organic loading or nutrient
loading is high, the oxygen will be depleted and these
cool water refuge areas are lost. Temperature and oxygen
profiles during the late summer define this limiting factor.
Similar information is available for other species either
by using information in the USFW habitat suitability indexes
that can be found at http://el.erdc.usace.army.mil/emrrp/emris/emrishelp3/list_of_habitat_suitability_index_hsi_models_pac.htm
The only assessment provided here is for salmonid
stream habitats but there are other assessment procedures
available for lakes, all freshwater and saltwater wetland
types, estuaries, and other coastal habitats.
Contact your NSSA adopt-a stream coordinator and local
experts for assistance in assessing these habitat types.
The stream survey form can be completed on a reach-by-reach
basis for detailed surveys or a more general sub-watershed
basis for general surveys.
Stream Survey summary form |
|
|
|


|
|
|
|